


Can we take on this project? Do we have the team for the job? Should we reallocate work or adjust the schedule? 🤔
As a project or resource manager, these (and more!) questions are essential to prevent your project from failing, avoid cost overruns, and protect your team from over- or underallocation.
Capacity planning reports give you the answers you need, presenting valuable insights into project health and resource availability. Whether you’re creating your first capacity planning report or just need a refresher, we’ll show you what a good report should look like, the essential metrics to track, and how to create and configure actionable reports with the help of resource management software.
What is a capacity planning report?
A capacity planning report is an overview of key metrics—like utilization rates and scheduled hours—that shows the demand and supply of resources across past, ongoing, and future projects.
The main purposes of a capacity report include:
- Assessing resource utilization levels to identify individuals with high or low workloads
- Observing trends in workloads to stay on top of increases or decreases
- Understanding effective capacity, and how much time is devoted to each project
- Giving insights into potential financial impacts if projects require more time than initially planned
- Helping your forecasting and decision-making for future project, including whether you may need to hire and onboard new resources
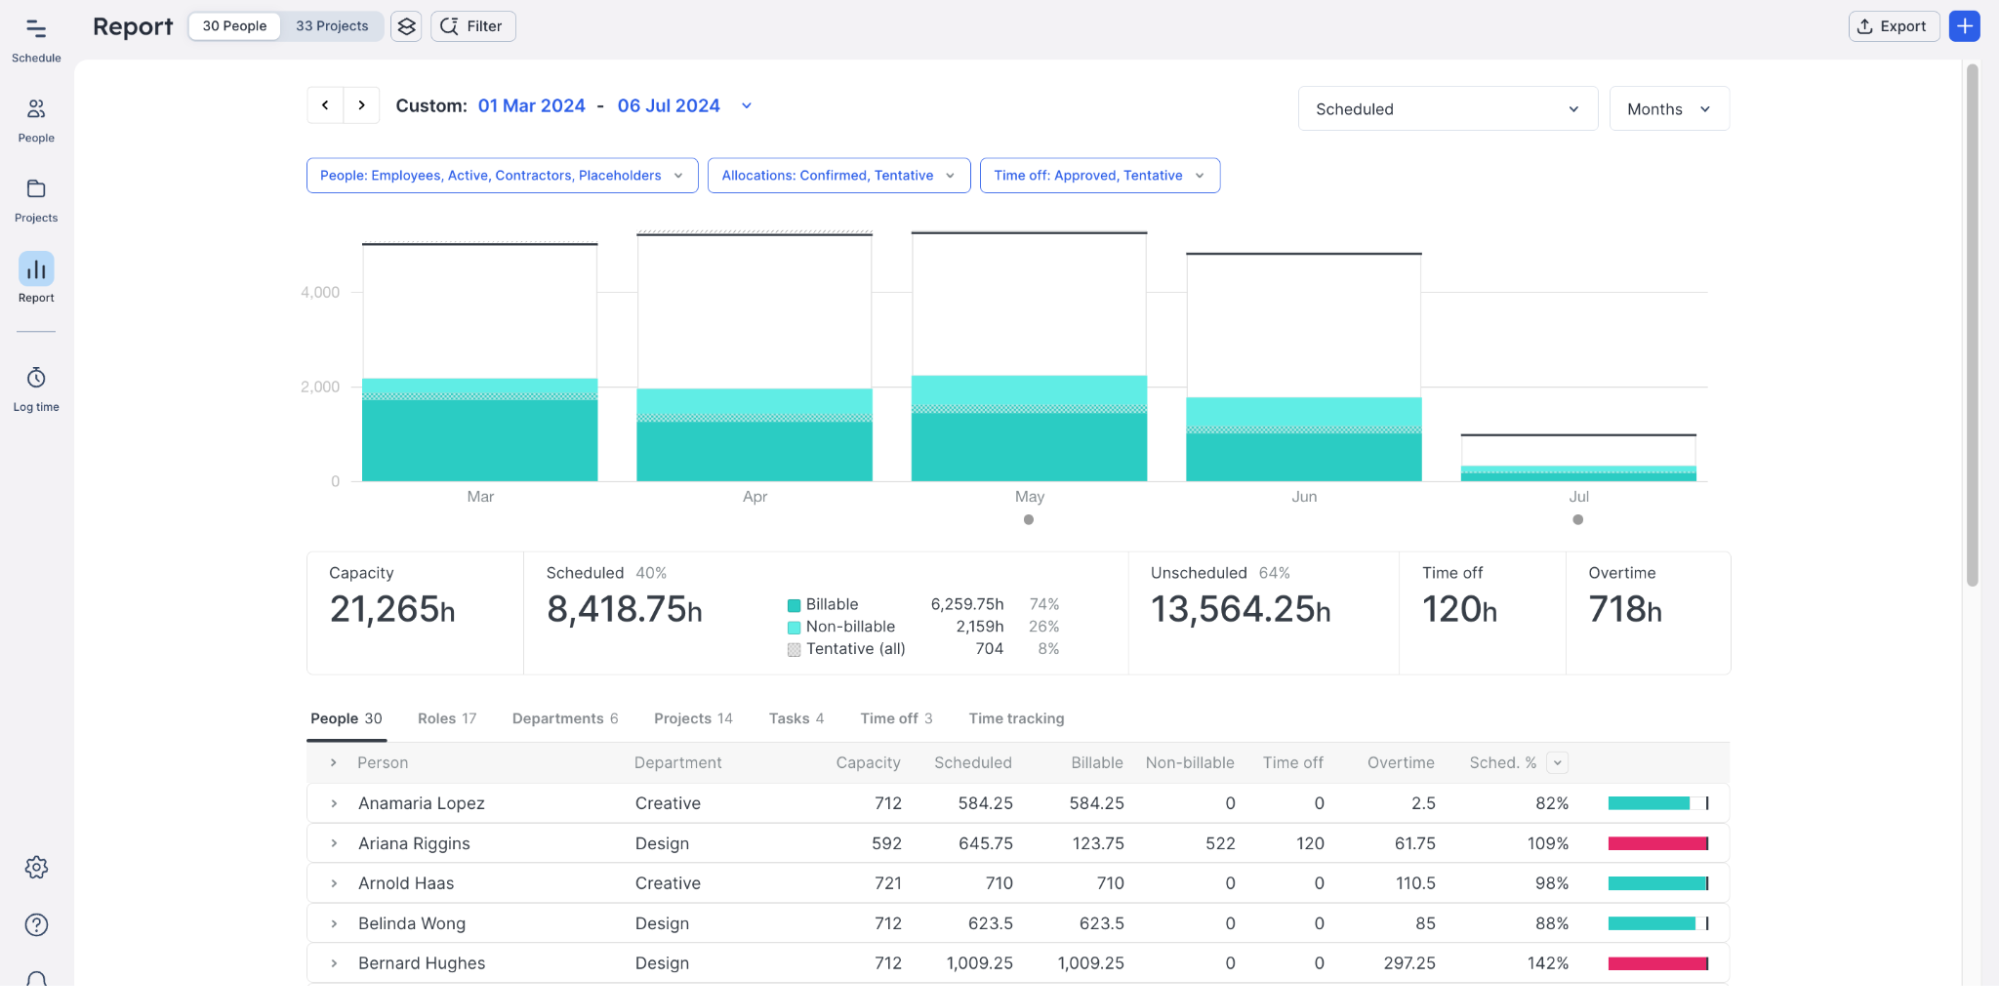
A good capacity planning report is concise and easy to understand, combining visual elements with metrics and additional context. Like this 👇
<cta-box>
<image-color="blue">
Simplify capacity reporting with Float
Float gives you an easy and efficient way to create accurate reports, with automated reporting that helps you monitor your team’s capacity across projects.
<cta-button>Explore Float’s reporting features </cta-button>
</cta-box>
2 types of capacity planning reports
There are two main types of capacity reports: resource capacity reports and project capacity reports. They differ based on the type of data they visualize and contextualize.
1. Resource capacity reports
Resource capacity reports or people reports outline the availability and utilization of team members and help you assess whether your team has the capacity to keep existing projects running and staff incoming work. They include metrics like:
- Team capacity and utilization levels
- Scheduled vs. billable hours
- Overtime
- Planned time off
- Billable and non-billable hours
Those are a lot of moving parts to stay on top of for a single report. But if you’re using a resource management tool, these metrics are already automatically tracked and recorded, and viewing a report is as simple as clicking a tab.
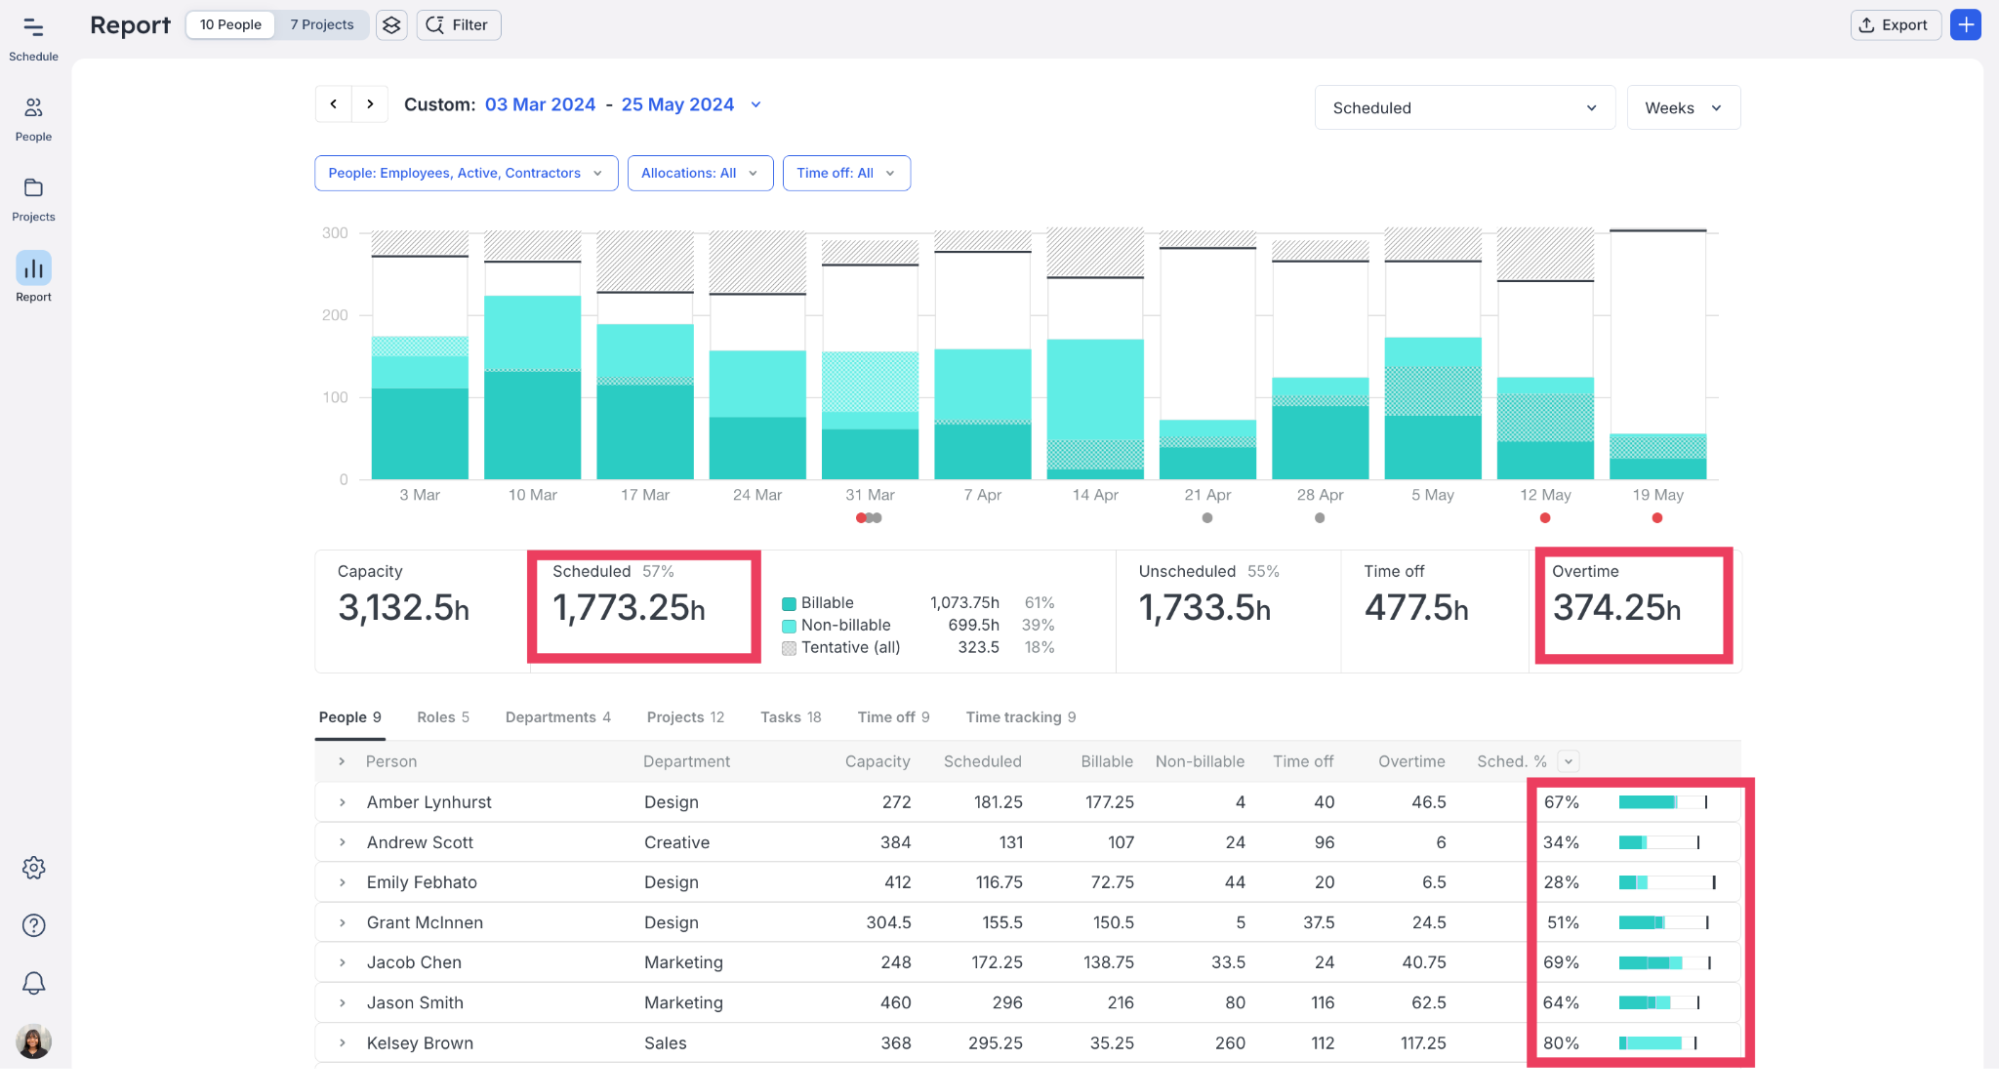
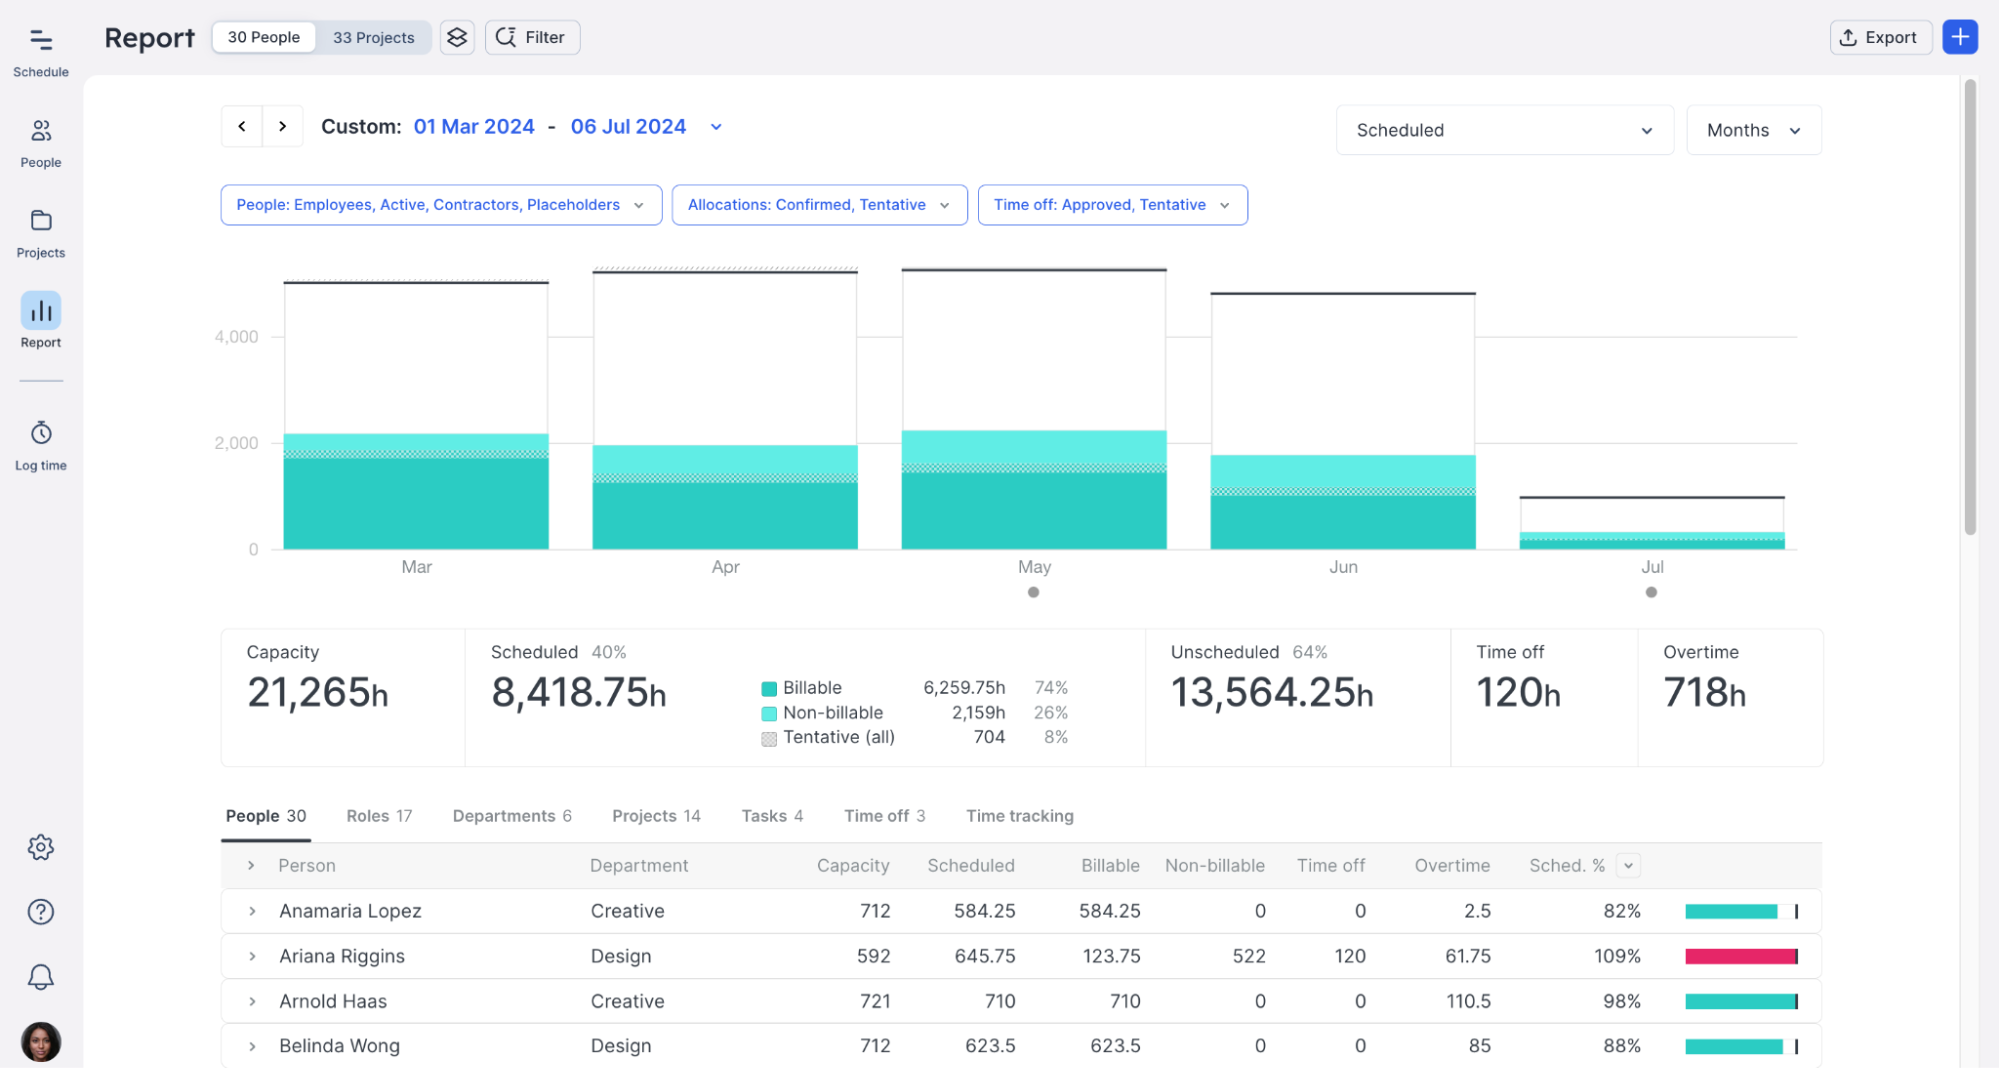
For example, in Float’s ‘Report’ dashboard, a report on team member capacity would look like this👇
Looking at this report, you’ll immediately be able to view insights like:
- How much of your team’s time is scheduled, in hours or percentage
- Who is over capacity (indicated by the red bar on the right)
- What percentage of your team and individual team members’ work is billable, non-billable, and tentative
2. Project capacity reports
Project capacity reports focus on the capacity and resources required for specific projects. They help improve project prioritization, identify potential risks, and assess the feasibility of taking on additional projects.
An effective project report should show:
- How resources are allocated across different projects
- Your team’s current capacity and the time dedicated to each project
- Projects consuming a significant portion of your team’s time
- Cost overruns if projects take more time than initially planned
For example, if you were looking to understand bandwidth across each project in Float, it would look like this👇
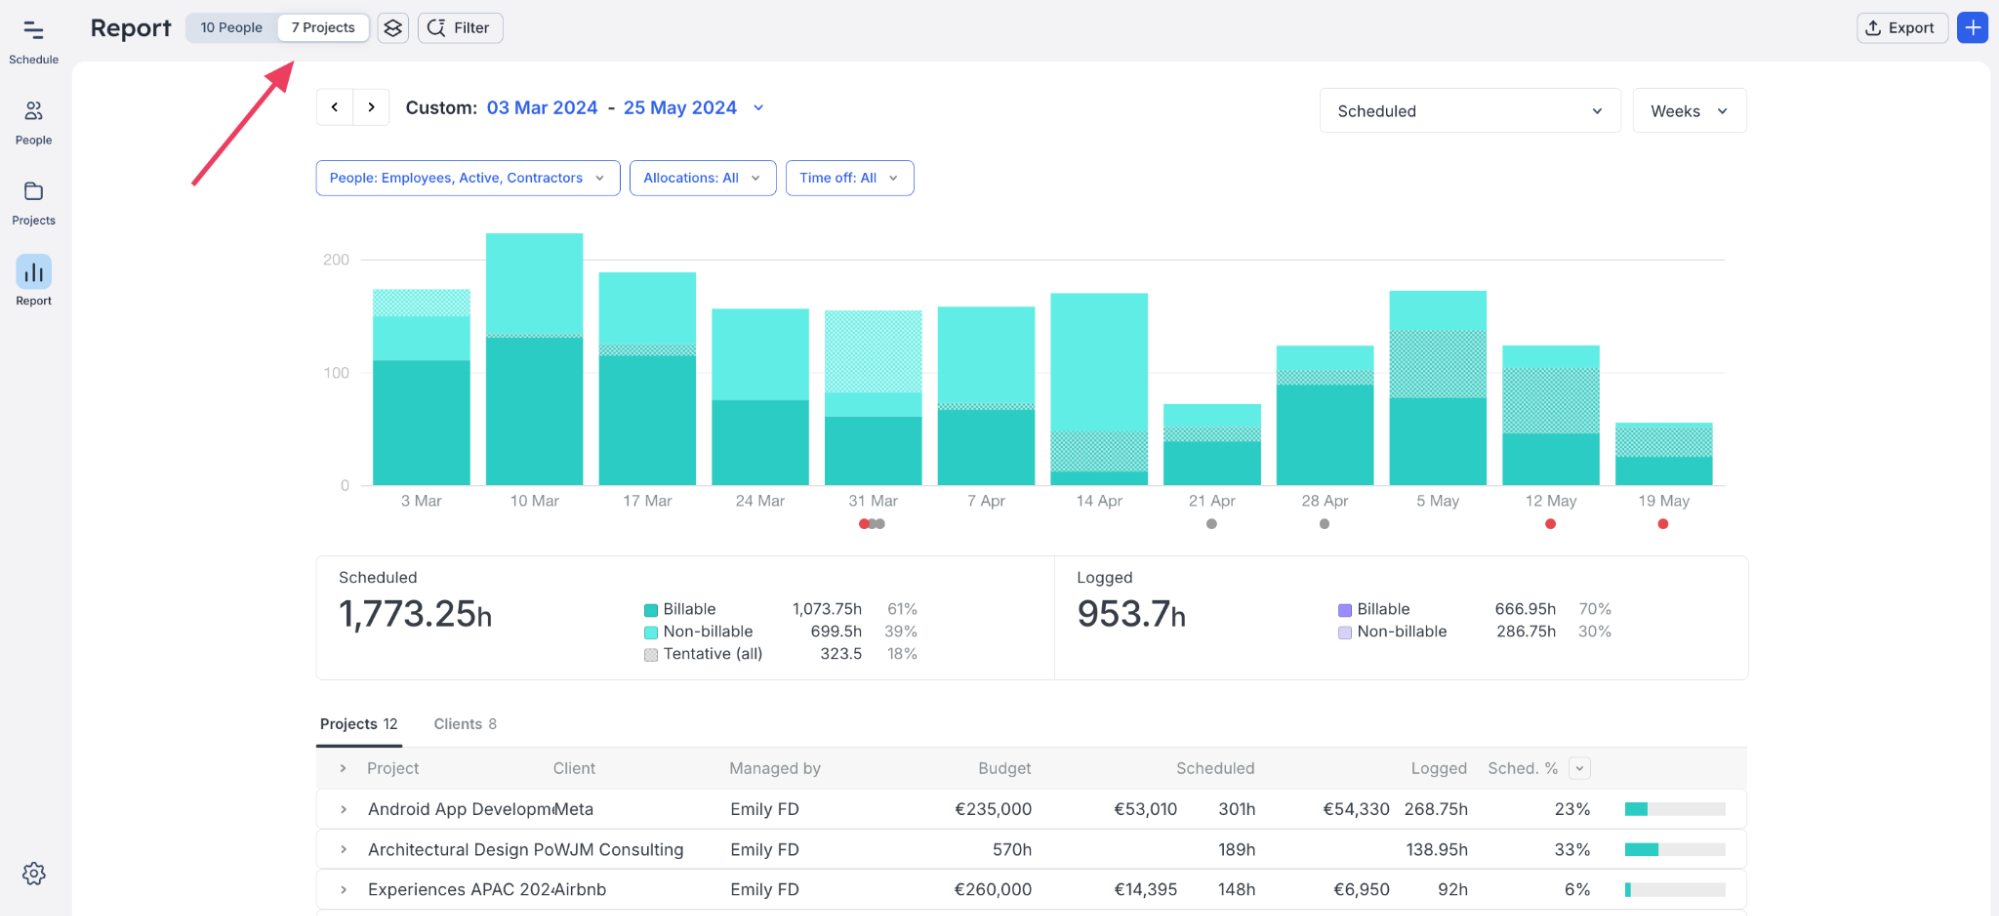
Unlike the People report, this Projects report shows:
- How many hours your team has logged on specific projects (if you’re using time tracking)
- Your individual project budgets
- Your project totals at the client level
<sme-box>
<sme-color=”purple”>
<sme-image>

</sme-image>
<sme-author>
Tiago Duarte
</sme-author>
<sme-position>
Project Manager at Significa
</sme-position>
<sme-quotes>
I use the reports at the end of the month to ensure that the accounts department has everything they need to bill at the end of the month. We don’t miss a bill. We don’t overcharge the customer. It gives us visibility into the company that we didn’t have before.
</sme-quotes>
</sme-box>
How to create an actionable capacity planning report in 5 steps (+ a downloadable template)
1. Define your objectives 🧭
Are you looking to show stakeholders how busy everyone is, plan out resources for the next quarter, or make a case for your team’s needs? Whatever your goal, it will shape the metrics you collect and the structure of your report.
For example, if you report on your design team’s workloads monthly, you’ll most likely gather data on utilization levels, scheduled hours, and overtime in your report. You might compare this with historical data from the previous 30 days to show month-over-month trends.
2. Gather your data 📈
Pull the most relevant data from your time tracking and capacity management tools on the metrics you want to track for a specific time period.
You could spend hours pulling data from different sources, like project management software and time tracking tools, and compiling it into a report. But if you’re already doing this, you’d agree that it’s incredibly time-consuming and prone to mistakes (and if you’re not doing it, consider yourself warned).
🔥 Our hot take is that your capacity planning software should do all the heavy lifting for you.
A tool like Float generates detailed reports automatically—all you need to do is set the date range, select the specific project or team members, and filter the report data by category.
📹 Watch a detailed walkthrough of how to use real-time reports in Float to improve your workflow
3. Tailor reports to your audience 🪡
Depending on your organization, you might need to prepare a report for your CEO, CFO, or Head of Operations.
To convey information effectively, consider:
- How much they know about capacity planning and resource management, in general
- What information they need to see in the report
Your ops lead might understand the specifics about resources, the terminology used, and the implications of certain trends. They might want to know which departments are short-staffed. On the other hand, your CEO or CFO might want a general overview of the state of capacity and benefit from more straightforward language.
<tip>
Pro tip: use filters in Float to customize reports for your stakeholders
Filter your data to highlight as much or as little information as needed, and save them as Views to share with specific stakeholders and tailor your report to their requirements. With visual reports customized to them, your audience can quickly grasp what the data means.
</tip>
4. Give enough context 📃
While numbers are important in reports, what makes them even more useful are visuals and explanations that provide context and meaning. The combination of quantitative and qualitative data helps stakeholders understand the implications of your report and guides them on what actions to take (more on this below).
For example, visual reports in Float give you an incredible amount of detail—you can even drill down into data for specific individuals or tasks. At a glance, the stakeholders viewing your report can tell who worked on a project, how much capacity certain team members have, or how many hours they’re scheduled for now and in the upcoming months.
<sme-box>
<sme-color=”purple”>
<sme-image>

</sme-image>
<sme-author>
Jason Fisher
</sme-author>
<sme-position>
Studio Director at Flight Story
</sme-position>
<sme-quotes>
My favorite functionality in Float is the report feature. Our CFO loves me because from day one, we had all these numbers we could pull for him straight away. And now that we’re getting to the point of growth where we do detailed time utilization tracking for our funding and for our investors, it’s never been an issue for him to pull that detail from Float, whereas the other teams have had to catch up and start tracking that manually.
</sme-quotes>
</sme-box>
5. Include recommendations 🎯
Based on the report insights, what actions should your team take? Structure your recommendations to address both immediate and future needs, making it clear how they align with the organizational goals.
For example, knowing that a project’s utilization rate is 95% doesn’t inherently convey whether that’s good, bad, or typical for the organization. However, explaining that a high utilization rate means the team has little room for unexpected situations and contingencies, which could jeopardize projects and cause the agency to miss its revenue targets, helps put everything in perspective.
💡 If you’re not sure where to get started, download and tweak our capacity planning report template
11 crucial capacity planning metrics to track
While the specific metrics in your capacity planning reports may vary depending on the insights you need, they should always reflect how your team spends their time at work. Below is a list of metrics 4,500 of our customers use to successfully track and report on team capacity.
1. Utilization rate
Utilization rate is a key metric that measures how much of your team’s available time is allocated to projects. It helps you ensure your team meets utilization targets and signals where team members are underutilized or over capacity.
2. Total capacity level
Total capacity level refers to the maximum amount of work your team can handle, measured in hours or as a percentage. It helps you plan and allocate resources effectively, avoid high workloads, and identify when additional resources may be needed.
3. Scheduled hours
Scheduled hours represent the amount of time allocated to specific tasks or projects for your team members. It covers billable, non-billable, and tentative hours. This metric helps in planning and scheduling work, ensuring that tasks are appropriately assigned and that due dates can be met.
4. Logged hours
Logged hours refers to the actual time spent by employees (or freelance consultants) on various tasks and projects. It includes all recorded work hours, whether billable or non-billable, providing a detailed account of resource usage.
5. Scheduled vs. logged hours
Scheduled vs. logged hours is a metric that compares the hours planned for a project with the actual hours worked. Discrepancies between scheduled and logged hours can show you where time estimation needs improvement, help identify bottlenecks, or highlight issues like scope creep.
6. Billable hours
Billable hours refer to the time that team members spend on tasks that can be invoiced to clients. Tracking billable hours is vital for assessing project profitability, deciding on task prioritization, and ensuring that time spent on client work is billed correctly.
7. Non-billable hours
Non-billable hours refers to the time employees spend on tasks that cannot be directly charged to a client. These activities often include internal meetings, training, and administrative work. While some non-billable work is necessary, consistently high levels may show your team is spending too much time away from profitable work.
8. Billable hours vs. non-billable hours
A balanced view of billable vs. non-billable hours is necessary to understand how much work generates revenue and how much accounts for administrative or non-revenue-generating activities. It helps ensure that the right mix of billable and non-billable hours is dedicated to both client work and essential internal tasks.
9. Billable % of scheduled hours
The billable % of scheduled hours metric represents the proportion of total scheduled working hours that are billable. This metric provides a clear picture of how much of the team’s scheduled time is devoted to tasks that contribute directly to the company’s income.
10. Time off
Time off helps you understand resource availability when planning project timelines. It also ensures that you adhere to labor laws and company policies regarding time off and that the workload is evenly distributed among all team members.
11. Overtime
Monitoring overtime helps you understand how effectively resources are being used. It shows you whether additional staffing or better time management is needed.
[fs-toc-omit]Source accurate capacity data with Float
You need a reliable resource management tool to get accurate data and create custom reports. Float gives you all the features you need for planning capacity, gathering data, and presenting information in a visual format that’s simple to understand and act on.
<cta-box>
<image-color="blue">
Try the #1 resource management software for capacity and resource planning
Float manages your team’s capacity on autopilot. Get a high-level view of your team’s workload, availability, and project pipeline to plan resources with confidence.
<cta-button>Explore Float’s capacity features</cta-button>
</cta-box>
<hr>
📚 Everything (else) you need to know about capacity planning
Now that you’re all clued up on reporting, dig deeper with more capacity planning resources:
- A tactical guide to capacity planning to reduce guesswork
- A complete guide on capacity management to move you from chaos to clarity
- A list of the seven best capacity planning software, complete with pros, cons, and pricing
- Tactics and tools from professional people planners to solve capacity management challenges
- An expert’s guide to agile capacity planning
<hr>
FAQs
Some FAQs about capacity planning reports
Capacity planning reports come in two main types:
- Resource capacity reports, which outline the availability and utilization of specific resources within an organization, help you assess if there’s enough capacity to meet current and future demands
- Project capacity reports focus on the capacity and resources required for specific projects and assess the feasibility of taking on additional work
Capacity planning reports should be updated regularly, typically monthly or quarterly, ensuring they reflect the most current information and accurately guide decision-making.
The key challenges in capacity planning include:
- Accurately forecasting uncertain demand
- Overcoming resource constraints
- Making strategic capacity trade-offs
- Coordinating with various stakeholders

.jpg)


